
So, we’re pleased to share our first Thank You for Closed Business (TYFCB) infographic map. TYFCB is simply a mechanism that we use to track business between members; it’s the way we track how successful we are in passing referrals.
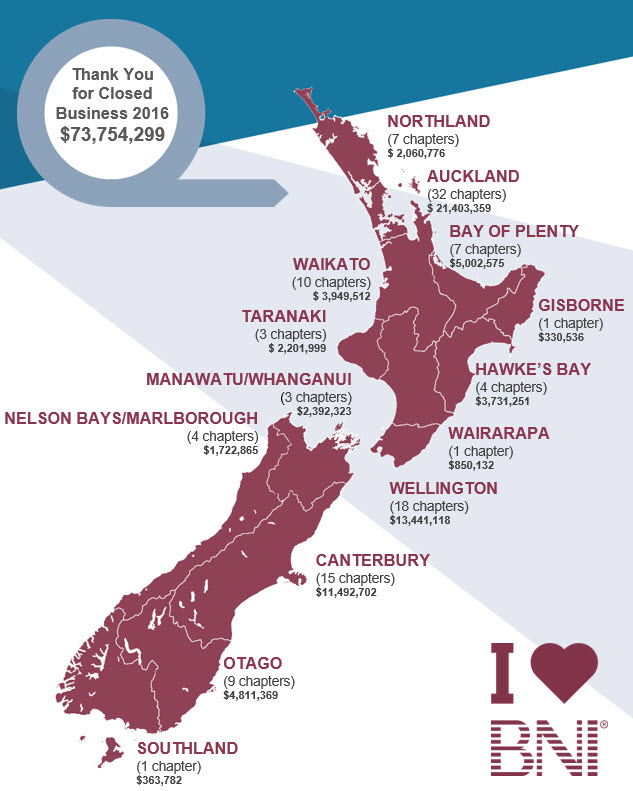
Our map notes the amount of closed business that was generated in BNI chapters throughout the country (broken down by region) in 2016. Auckland’s 32 chapters generated over 21 million dollars in business while Wellington made over 13 million and Christchurch 11 million.
The Top Stats:
- Hawke’s Bay recorded the highest average TYFCB per member by region in North Island @ $40,337.85.
- Canterbury achieved the highest average TYFCB per member by region in South Island @ $34,010.13.
- BNI North Harbour recorded the highest average TYFCB per member by chapter @ $89,633.79, they were followed closely by BNI Remuera @ $88,739.21 and BNI The Advocates @ $87,241.14.
We want to keep members informed about how we’re doing on an ongoing basis. We will be updating this map monthly so members are aware of how other regions are doing in New Zealand. Our hope is by developing and sharing this infographic we can clearly see how we are doing in terms of our goals for referrals – the reason we are all in BNI.
We look forward to your feedback on the map and hope it spurs everybody on to bigger and better things.